Report Designer
QReport, the Report Designer
QReport is a fully-functional Report Designer that runs as a standalone desktop application. Report Designer is a modified version of DataDynamic's highly-rated end-user Report Designer. The designer is completely scriptable (using the C# language) with access to all events, including:
Detail, header and footer events: Format, BeforePrint, AfterPrint.
Report events: ReportStart, ReportEnd, PageStart, PageEnd, DataInitialize, FetchData, NoData.
With the designer, you can design virtually any type of report, test it and upload it to the central server site, so that it is available to you or any authorized user at any time.
The designer will be familiar to anyone who has worked with contemporary report designers.
The installed version includes:
Underlying code to intercept all data requests to ensure the requester is a valid user and has access rights to the data.
Interface code and form to enable user selection of a data source and SQL query design.
Storage of the query design inside the report design.
Code intercept to distinguish between column requests and data requests.
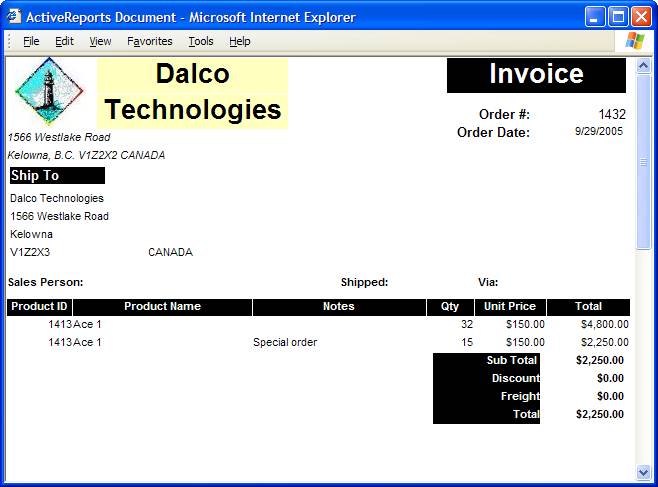
Loading an existing standard report for customizing: example: order form
See Report File Manager - Order form example
Interfaces:
a. Report storage and retrieval:
Server-side report storage and delivery through the Report File Manager module. Upload existing report formats from the host server for viewing and modification in the Report Designer. Download new and modified formats from the local computer to the host server.
b. SQL expression creation: see the Construct query form on this help page. Query definitions are saved inside the report definition and can also be saved to disk, enabling them to be used in other queries.
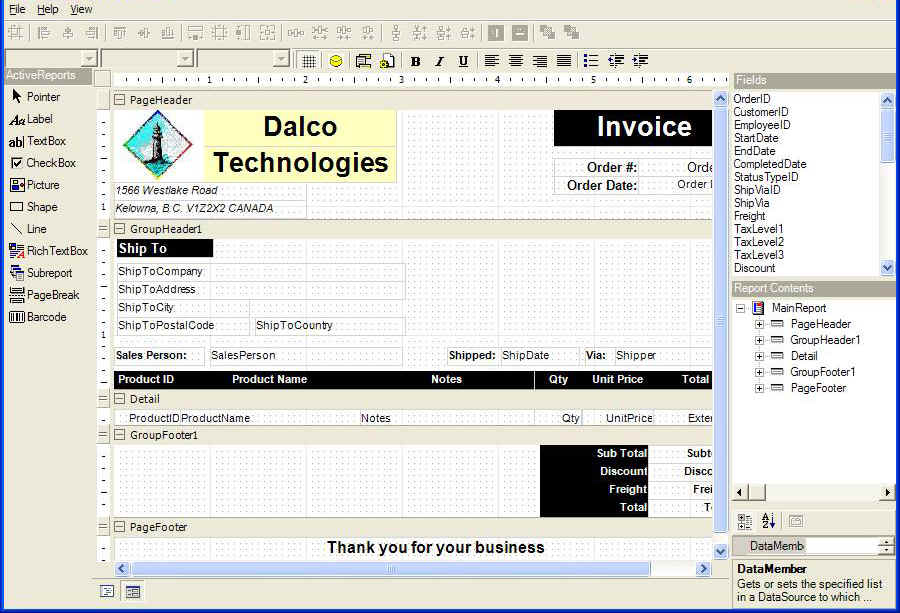
Designer:
The designer is sectioned into:
-
File menu: Print preview, load/save layout, page setup and exit.
-
Object list (down the left side)
-
Data source selection/SQL definition and formatting tools - menus across the top
-
Report workspace - defaulting to PageHeader, Detail and PageFooter sections
-
Field list (after a data source has been been specified and an SQL expression created).
-
Report contents - a tree list of the report and its objects.
-
Properties window - the properties of the selected object. Contents vary according to the object type, but the main sections are:
Appearance: color, alignment, format, etc.
Behavior: wrap, grow, shrink, etc.
Data: Class, data field, links, etc.
Design: object name
Layout: positioning information
Misc: miscellaneous settings
Summary: Settings for accumulators, distinct field, etc.
-
Tabs (bottom of designer)
 - script window and form workspace
Objects:
Label: provide descriptions and information.
TextBox: typically contains information from a data field.
CheckBox: boolean information.
Picture: image
Shape: various shapes can be configured.
Line: vertical/horizontal lines
Richtextbox: supports extended text
Subreport: enables a subreport within the main report.
PageBreak: forces a page break.
Barcode: allows a bar code entry.
Drag/drop objects onto the applicable section of the report. Assign data fields where applicable. Right-click to format border, send to front/back and other options.
Selecting an ODBC Data Source - the basic database
When you installed the Desktop (which included QReport Report Designer), the installation program will have automatically installed a Microsoft Access database that contains the base tables and fields used in the central database and an ODBC data source.
Although your custom fields will not be in this database there is often sufficient to work with for most report design purposes.
It's named Q_LocalAccess and you can access it from the drop down list in the Construct Query Form (see below-click here) for most of your data design purposes.
If you want to access the actual central database, you will need to work with your administrator to set up an ODBC Data Source pointing to that database.
Setting up an ODBC Data Source:
The Report Designer accesses any database through the ODBC Data Source Administrator. Have your administrator set up an ODBC Data source to your database, or, better yet, to an extracted, field-only Microsoft Access version of your database.
We strongly recommend the latter. The administrator would create a Microsoft Access database from the company's central database, with that Access database containing no data, just the "schema".
The administrator would then copy the Microsoft Access database to your computer (or the computer where you are running the Report Designer) and would set up an ODBC Data Source on that computer pointing to that Access database.
A "field-only" copy with no data is much safer from a security viewpoint.
Another alternative is to use a standard Microsoft Access database by contacting us. That database won't have any of your custom fields, but you can either add them directly to the Access database or create your reports without those fields.
If you need more help on setting up and ODBC Data Source, write us describing your needs and we will point you to some help.
Data:
Click the yellow data container to specify the data source and create the SQL expression. See Construct query form below.
After clicking [OK] from the Construct query form, the fields contained in the SQL expression will display in the right-hand field list area:
Drag/drop fields onto the applicable section of the report. Use the up/down/left/right arrow keys to absolutely position the objects. Use the mouse to increase/decrease height/width, or set the applicable property for the object.
Set CanGrow to true to allow automatic expansion of the height of the object where the content dictates. The report will expand by that amount. Consider using a before print event to evaluate the size of text boxes, and limiting their display height based on number of characters in the text box. Set CanShrink as needed.
Create summary fields as textboxes, set the distinct field to be summarized on, set the summary criteria.
Right-click in the design workspace area to insert Report Header/Footers, Page Header/Footers (if not already on the report), Group Header/Footers.
The construct query form is used to design moderately-complex SQL expressions, including linked fields and joins. For more complex designs, use any other query builder (including Microsoft Access) to create the expression, then paste that expression into the SQL display box.
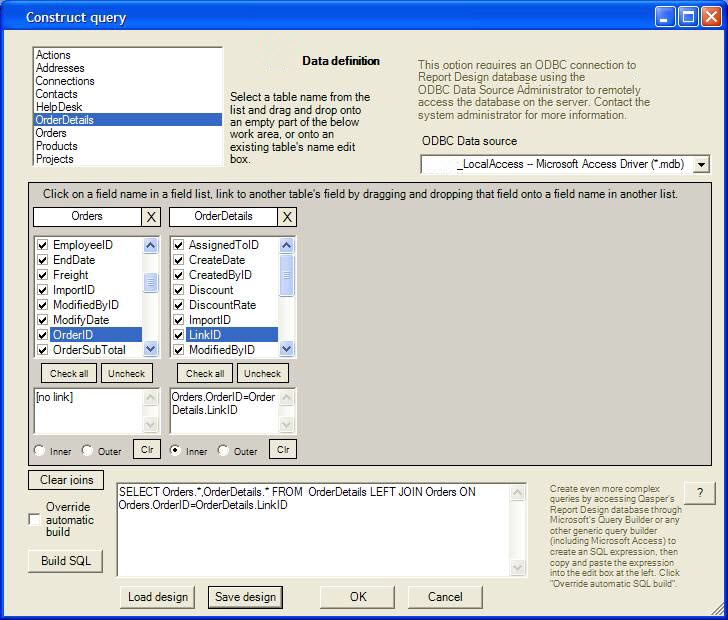
![]() - Select a data source
- Select a data source
Table
list: click on a table name, drag/drop onto an empty part of the
work area or drag/drop onto an existing table header box ![]() to populate the list area with field names:
to populate the list area with field names:
![]() - Select or deselect all fields in list area.
- Select or deselect all fields in list area.
Joins: click and hold on a source field and drag/drop on a destination field. The link will display in the destination field's link area.
![]() - If an inner (left) or outer (right) join is required, select the
appropriate option button under the applicable table list. Only one
join is allowed per definition.
- If an inner (left) or outer (right) join is required, select the
appropriate option button under the applicable table list. Only one
join is allowed per definition.
![]() - click to clear the join
- click to clear the join
![]() - click to clear the inner or outer join
- click to clear the inner or outer join
 - click to insert a custom SQL expression built elsewhere. Selecting
this option ensures that the definition won't automatically override
that custom expression. When selected, the [Build SQL] button is
disabled.
- click to insert a custom SQL expression built elsewhere. Selecting
this option ensures that the definition won't automatically override
that custom expression. When selected, the [Build SQL] button is
disabled.
![]() - construct the
SQL expression
- construct the
SQL expression
![]() - click to retrieve an existing SQL query definition.
- click to retrieve an existing SQL query definition.
![]() - Save the
query design to disk. This allows the query to be used in other
designs.
- Save the
query design to disk. This allows the query to be used in other
designs.
![]() - Close the
query, save the definition inside the report design, use the SQL expression to fetch the fields, and return them to
the design workspace.
- Close the
query, save the definition inside the report design, use the SQL expression to fetch the fields, and return them to
the design workspace.
Scripting:
The report designer accommodates full scripting, with access to all events. Click the script tab at the bottom of the designer to invoke the script page:
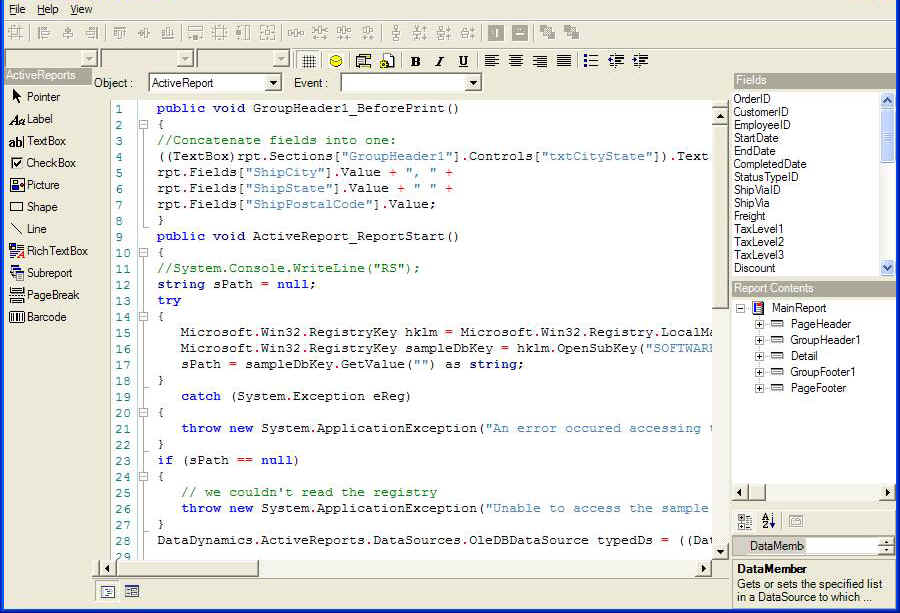
-
Object: select the type: designer, header, detail, footer
-
Event: select the event:
Detail, header and footer events: Format, BeforePrint, AfterPrint.
Report events: ReportStart, ReportEnd, PageStart, PageEnd, DataInitialize, FetchData, NoData.
-
Enter C# code as required in the script numbered area.
Some script examples -
NOTE: always save your layout after making script changes in order for the changes to take effect.
public void GroupHeader1_BeforePrint()
{
//Concatenate fields into one:
((TextBox)rpt.Sections["GroupHeader1"].Controls["txtCityState"]).Text =
rpt.Fields["ShipCity"].Value + ", " +
rpt.Fields["ShipState"].Value + " " +
rpt.Fields["ShipPostalCode"].Value;
}
public void ActiveReport_ReportStart()
{
//System.Console.WriteLine("RS");
string sPath = null;
try
{
Microsoft.Win32.RegistryKey hklm = Microsoft.Win32.Registry.LocalMachine;
Microsoft.Win32.RegistryKey sampleDbKey = hklm.OpenSubKey("SOFTWARE\\Dalco\\CustomReports\\SampleDB");
sPath = sampleDbKey.GetValue("") as string;
}
catch (System.Exception eReg)
{
throw new System.ApplicationException("An error occured accessing the registry key 'SOFTWARE\\Dalco\\CustomReports\\SampleDB'.", eReg);
}
if (sPath == null)
{
// we couldn't read the registry
throw new System.ApplicationException("Unable to access the sample database registry value
'SOFTWARE\\Dalco\\CustomReports\\SampleDB'.");
}
DataDynamics.ActiveReports.DataSources.OleDBDataSource typedDs = ((DataDynamics.ActiveReports.DataSources.OleDBDataSource)(rpt.DataSource));
typedDs.ConnectionString = "Provider=Microsoft.Jet.OLEDB.4.0;Persist Security Info=False;Data Source=" + sPath + "\\nwind.mdb";
}
public void GFOrderID_BeforePrint()
{
((TextBox)rpt.Sections["GFOrderID"].Controls["txtTotal"]).Text =
(System.Double)((TextBox)rpt.Sections["GFOrderID"].Controls["txtFreight"]).Text
+ (System.Double)((TextBox)rpt.Sections["GFOrderID"].Controls["txtSubTotal"]).Text;
}
Save layout - upload to the central server:
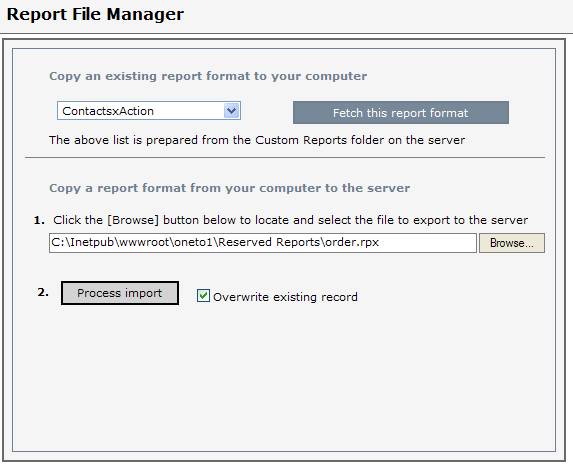
After designing and saving a report layout, use the Report File Manager module to upload it to the CustomReports folder on the main server.
You can then use the Reports module to fetch and run the report (ensure you click the Custom reports option button beside the "Select a report" option.
Below,
the ![]() button is clicked to
locate the file to upload to the server.
button is clicked to
locate the file to upload to the server.
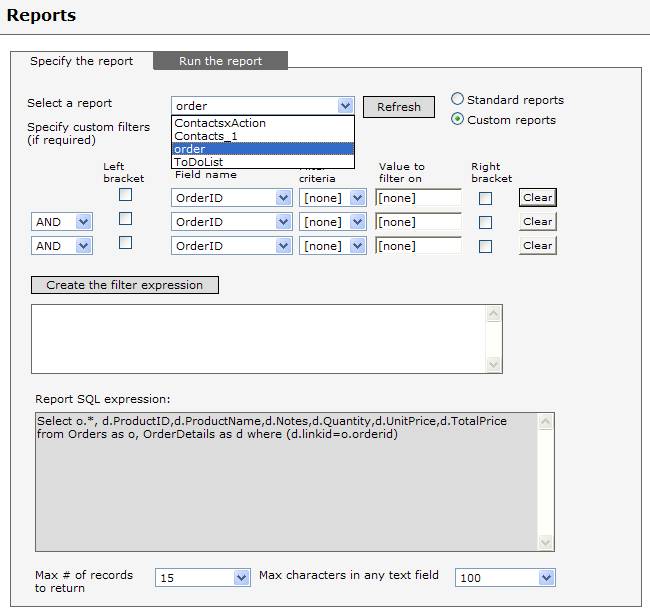
After
uploading the layout, use the Report module to access and
run the report. Note that the ![]() option has been selected.
option has been selected.
Run the report
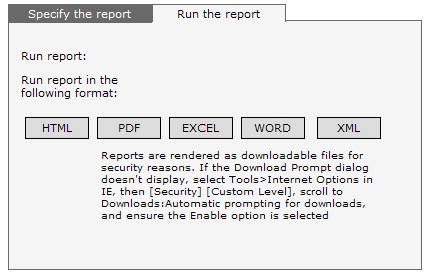
Send a file to your browser
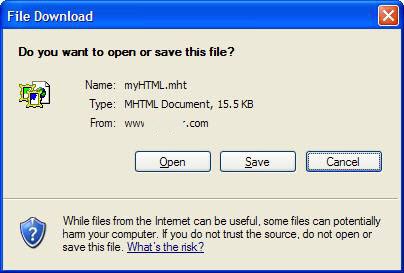
Open the report